
| 일 | 월 | 화 | 수 | 목 | 금 | 토 |
|---|---|---|---|---|---|---|
| 1 | 2 | 3 | ||||
| 4 | 5 | 6 | 7 | 8 | 9 | 10 |
| 11 | 12 | 13 | 14 | 15 | 16 | 17 |
| 18 | 19 | 20 | 21 | 22 | 23 | 24 |
| 25 | 26 | 27 | 28 | 29 | 30 | 31 |
- 캐글 신용카드 사기 검출
- 그로스 해킹
- 데이터 핸들링
- 리프 중심 트리 분할
- DENSE_RANK()
- sql
- tableau
- 분석 패널
- 데이터 정합성
- 인프런
- splitlines
- 로그 변환
- WITH CUBE
- 데이터 증식
- lightgbm
- pmdarima
- ImageDateGenerator
- WITH ROLLUP
- 마케팅 보다는 취준 강연 같다(?)
- ARIMA
- 3기가 마지막이라니..!
- XGBoost
- 부트 스트래핑
- 캐글 산탄데르 고객 만족 예측
- 그룹 연산
- 스태킹 앙상블
- Growth hacking
- 컨브넷
- 그로스 마케팅
- python
- Today
- Total
LITTLE BY LITTLE
[ch_02] Hands on Data Analysis With Pandas - Basic Structure (str.contains, filtering, assign, concat, pop ..) 본문
[ch_02] Hands on Data Analysis With Pandas - Basic Structure (str.contains, filtering, assign, concat, pop ..)
위나 2022. 10. 7. 15:02Ch_02 Basic Structure
- Pandas_Data_Structure
- DataFrame_Operations
- max([row[3] for row in data])
- 넘파이 배열 numpy array 에서 => dictionary로 변환 : { col : np.array(row[i] for row in data]) for i, col in enumerate(data.dtypes.names)}
- np.linspace(start,stop,num=)로 넘파이 배열 생성
- 넘파이 배열 numpy array 에서 => dataframe로 변환 : pd.DataFrame(array_dict)
- 시리즈 생성 => pd.Series(딕셔너리['컬럼 이름'], name=이름지정)
- pd.Series(numbers, index=pd.index([리스트]))
- series.values 확인
- series_index = series.index로 인덱스 추가
- 시리즈에서 => dataframe으로 변환 : pd.Series(np.linspace(0,10,num=5)).to_frame()
- 데이터프레임 안에 리스트 형태로 딕셔너리 넣어서 바로 생성 pd.DataFrame([{'col_1':01},{..}.,])
- 데이터프레임 안에 리스트 형태로 튜플/넘파이 배열 넣어서 바로 생성 list of tuples = [(n, n**2) for n in range(5)] 정의 후 pd.DataFrame(list_of_tuples, columns = ['col1','col2'])
- Making_DataFrames_From_Api_Requests
- Insepecting A DataFrame Object
- df.empty(차원 확인) df.shape, df.columns
- pd.set_option, pd.reset_option, pd.describe_option ... - 더 많은 컬럼을 보기 위해서 display 옵션 수정 가능
- percentile 확인 df.describe(percentiles=[0.05,0.95])
- df.describe(include=np.object) => 특정 데이터 타입인 변수들의 descibe만 볼 수도 있음
- 혹은 변수명만 입력 df.alert.describe() / df.alert.unique() <=> df.alert.value_counts()
- Subsetting_Data
- .rename 변수명 변경
- df.rename(columns={'value':'temp_c', 'attributes':'flags'})
- .columns 컬럼명 확인
- .dtypes 데이터타입 확인
- pd.to_datetime(df.date) 변경
- read_csv에서 index_col='date'옵션으로 읽어온 후, .tz_localize 로 set up the timezone info
- .tz_convert() : change the time zone into a different one
- to_period() : datetime을 truncate (ex. to_period(M) : Month로 truncate)
- .assign()
- df.assign(date=pd.to_datetime(df.date)) : assign안에서 데이터 타입 변경 가능
- astype()
- df.station.astype('category') : 컬럼명 하나 변경시 astype() 사용
- pd.Categorical(['med','med','low','high'], categories = ['low','med','high'],ordered=True) 순서 변경
- .sort_values(by='변수명', ascending=False) : 리스트로 2개이상 입력 가능, ascending여부도
- sort_index() : 인덱스 값으로 정렬
- to target columns, must pass axis=1 => df.sort_index(axis=1)
- set_index() : 특정 컬럼으로 설정 (inplace=True해주기)
- .reset_index() : 리셋
- .sample(n, random_state=0)
- .nlargest(n=10,columns='temp_C')
- .nsmallest
- .startswith('')
- slicing
- df[['title','time']][100:103] => combine row and column selection together
- indexing
- loc[10:15, ['title','mag']] - 레이블 베이스
- iloc[10:15, [19, 8]] - Integer 베이스
- filtering
- df[df.mag>=7.0,['alert','mag']
- df.place.str.contains('Alaska')
- df.alert.notnull()
- df.mag.idxmax(), df.mag.idxmin()
- df.isin()
- create new data
- df['source'] = 'USGS_API'
- df['mag_negative'] = df.mag<0
- df.place.str.extract(r', (.*$)')
- %는 end의미
- r은 정규식,
- 괄호 안은 패턴
- .은 'any word'
- *은 everything => .* => any pattern, .*% => any pattern until the end
- df.place.str.extract(r', (.*%)')[0].sort_values().unique()
- df['parsed_place'] = df.place.str.replace(r'.*of')'',regex=True # remoe <x> of
- make many new columns as once with assign() method
- df.assign(in_ca=df.parsed_place.str.endswith('California'), in_alaaska=df.parsed_place.str.endswith('Alaska').sample(5, random_state=0)
- assign method also accepts lambda function
- ex. assign(neither=lambda x: ~x.in_ca & ~x.in_alaska)
- 데이터프레임 분리하기
- tsunami = df[df.tsunami ==1]
- 데이터프레임 합치기
- pd.concat([tsunami, no_tsunami])
- concat()은 index를 사용함에 주의 index를 기준으로 합쳐지기 때문에, null값이 많이 생김
- join=outer : keep everything(디폴트)
- join=inner : 공통된부분만 합침
- ignore_index=True=> assign new sequential index (새롭게 인덱스 부여)
- tsunami.append(no_tsunami)
- additional columns = pd.read_csv('data.csv',usecols=['tz','felt','ids'] => pdl.concat([df.head(2), additional_columns.head(2)], axis=1)
- pd.concat([tsunami, no_tsunami])
- del df['sourse']
- mag_negative = df.pop('mag_negative')
- df.drop([0,1]) : 여러개 rows and columns 를 삭제하는 경우
- .rename 변수명 변경
- Adding_And_Removing_Data
- df에 열 추가 ex. df['mag_negative'] = df..ag<0
- parsing (ex. by 필요 없는 문자 replace..)
- assign() 메소드로 여러 컬럼 한번에 생성 df.assign(newcol_1 = df.parsed_place.str.endswith('California'),new_col_2=....)
- lambda() 이용해서 활용할 수 있음 => 2개의 열 만든 후, 그 열에 속하지 않는 변수만 담은 열을 생성하고자 할 때 => df.assign(col_1=..., col_2=..., neither = lambda x: ~x.in_ca & ~x.in_alaska).sample(5, random_state=0)
- concatenation
- pd.concat([df1,df2]) == df1.append(df2)
- concat 하기 전에 index allign해주기 => pd.concat(join='inner', ignore_index=True)
- 컬럼 삭제
- del df['col1']
- col = pop('col1') => pop은 빼내서 저장해놓는 느낌, 후에 시리즈로 사용 df[col].head() => pop한 데이터만 출력 *여러개 입력 안됨,,
- drop(axis=0이 디폴트이지만, 컬럼이 입력될 경우 자동으로 컬럼을 삭제함) *리스트 입력 가능
2-1. Pandas Data Structure
넘파이 배열
csv 파일 불러오기
import numpy as np

data = np.genfromtxt(
    'data/example_data.csv', delimiter=';',
    names=True, dtype=None, encoding='UTF'
)
datadata.shapedata.dtypeSearch for maximum magnitude
%timeit
max([row[3] for row in data])
Instead, if we create a NumPy array for each column, this operation is much easier
Numpy array 딕셔너리로 변환
array_dict = {
    col: np.array([row[i] for row in data])
    for i, col in enumerate(data.dtype.names)
}
array_dict
시리즈
import pandas as pd

place = pd.Series(array_dict['place'], name='place')
place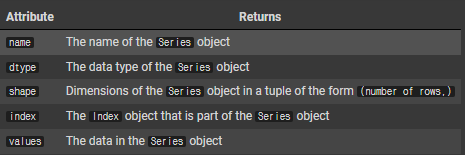
Isolating the values from series
place.values시리즈에 인덱스 추가
place_index = place.index
place_index
numpy 연산
np.array([1, 1, 1]) + np.array([-1, 0, 1])[Out]
array([0, 1, 2])numbers = np.linspace(0, 10, num=5) # makes numpy array([0, 2.5, 5, 7.5, 10])
x = pd.Series(numbers) # index is [0, 1, 2, 3, 4]
y = pd.Series(numbers, index=pd.Index([1, 2, 3, 4, 5]))
x + y[Out]
]
numbers = np.linspace(0, 10, num=5) # makes numpy array([0, 2.5, 5, 7.5, 10])
x = pd.Series(numbers) # index is [0, 1, 2, 3, 4]
y = pd.Series(numbers, index=pd.Index([1, 2, 3, 4, 5]))
x + y
0 NaN
1 2.5
2 7.5
3 12.5
4 17.5
5 NaN
dtype: float64데이터 프레임
numpy_array => dataframe 변환
df = pd.DataFrame(array_dict)

# this will also work with the first representation
# df = pd.DataFrame(data)

df

df.dtypes
df.values
df.columns
df.index
df.shape
df + df # 데이터프레임끼리 연산도 가능
2-2. DataFrame_Operations
import datetime as dt
import numpy as np
import pandas as pd
시리즈 만들기
np.random.seed(0) # set a seed for reproducibility
pd.Series(np.random.rand(5), name='random')
to_frame() 메소드로 create DataFrame from a Series Object
pd.Series(np.linspace(0, 10, num=5)).to_frame()Create DataFrame From ' a dictionary of list-like structures '
np.random.seed(0) # set seed so result is reproducible
pd.DataFrame(
    {
        'random': np.random.rand(5),
        'text': ['hot', 'warm', 'cool', 'cold', None],
        'truth': [np.random.choice([True, False]) for _ in range(5)]
    },
    index=pd.date_range(
        end=dt.date(2019, 4, 21),
        freq='1D',
        periods=5,
        name='date'
    )
)
Create DataFrame From ' a list of dictionaries '
pd.DataFrame([
    {'mag': 5.2, 'place': 'California'},
    {'mag': 1.2, 'place': 'Alaska'},
    {'mag': 0.2, 'place': 'California'},
])
Create DataFrame From ' a list of tuples'
list_of_tuples = [(n, n**2, n**3) for n in range(5)]
list_of_tuples
pd.DataFrame(
list_of_tuples,
columns=['n', 'n_squared', 'n_cubed']
)Create DataFrame From ' a Numpy Array '
pd.DataFrame(
np.array([
[0, 0, 0],
[1, 1, 1],
[2, 4, 8],
[3, 9, 27],
[4, 16, 64]
]), columns=['n', 'n_squared', 'n_cubed']
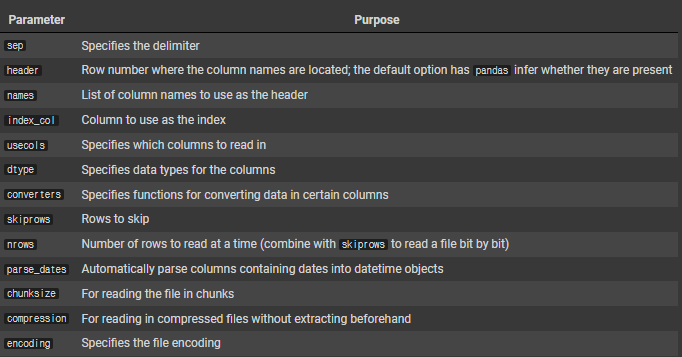
)pd.read_csv Parameters
Create DataFrame From ' a DataBase '
import sqlite3

with sqlite3.connect('data/quakes.db') as connection:
    pd.read_csv('data/tsunamis.csv').to_sql(
        'tsunamis', connection, index=False, if_exists='replace'
    )
Create DataFrame From ' a db file '
import sqlite3

with sqlite3.connect('data/quakes.db') as connection:
    tsunamis = pd.read_sql('SELECT * FROM tsunamis', connection)

tsunamis.head()
2-3. Making DataFrames From Api Requests
To make API requests, request 패키지 필요
import datetime as dt
import pandas as pd
import requests
yesterday = dt.date.today() - dt.timedelta(days=1)
api = 'https://earthquake.usgs.gov/fdsnws/event/1/query'
payload = {
'format': 'geojson',
'starttime': yesterday - dt.timedelta(days=30),
'endtime': yesterday
}
response = requests.get(api, params=payload)
# let's make sure the request was OK
response.status_code2-4. Inspecting DataFrames
Examining DataFrames
import numpy as np
import pandas as pd

df = pd.read_csv('data/earthquakes.csv')df.emptydimension 확인
df.shapedf.columnsdf.head()df.tail(2)Can modify the display options to see more columns
pd.get_option('display.max_columns')
# 20
pd.set_option('display.max_columns',26)
pd.options.display.max_columns = 26
pd.reset_option('display.max_columns')
pd.describe_option('display')
Specifying the 5th and 95th percentile
df.describe(percentiles=[0.05, 0.95])Describe Specific data types 특정 dtype인 컬럼의 정보만 보기
df.describe(include=np.object)df.describe(include='all')컬럼명만 입력
df.felt.describe()df.alert.unique()unique 값 개수 세주는 value_counts()
df.alert.value_counts()인덱스 관련 메소드

2-5. Subsetting Data
import pandas as pd

df = pd.read_csv('data/earthquakes.csv')df.maglist comprehensions : [col for col in df.columns if col.startswith('mag')] and string operations
를 이용해 select columns
df[
    ['title', 'time']
    + [col for col in df.columns if col.startswith('mag')]
]
list assemble하기
['title', 'time'] \
+ [col for col in df.columns if col.startswith('mag')]
만든 assembled list 추가
df[
    ['title', 'time']
    + [col for col in df.columns if col.startswith('mag')]
]
import pandas as pd
df = pd.read_csv('/content/earthquakes.csv')select data by using list + string operations
df[
    ['title', 'time']
    + [col for col in df.columns if col.startswith('mag')]
]col.startswith()
[col for col in df.columns if col.startswith('mag')]리스트 합치기
['title', 'time'] \
+ [col for col in df.columns if col.startswith('mag')]
df[
['title', 'time']
+ [col for col in df.columns if col.startswith('mag')]
]select rows and columns (슬라이싱은 마지막 인덱스 미포함)
df[['title', 'time']][100:103]
# 리스트 순서 바꿔도 무관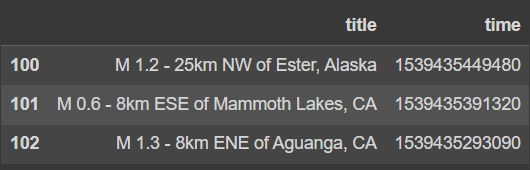
Update Values ( loc 이용)
df.loc[110:112, 'title'] = df.loc[110:112, 'title'].str.lower()
df.loc[110:112, 'title']
전체 데이터의 title 출력 (행은 data, 열은 column)
df.loc[:,'title'](주의) loc을 이용해서 select할 경우, loc은 마지막 인덱스 포함(<->슬라이싱은 미포함) (loc은 label base)
df.loc[10:15, ['title', 'mag']]
iloc은 슬라이싱처럼 마지막 인덱스 미포함 (iloc은 integer base) => 즉, loc만 마지막 인덱스 포함
df.iloc[10:15, [19, 8]]iloc/loc + 슬라이싱
df.iloc[10:15, 6:10].equals(
    df.loc[10:14, 'gap':'magType']
)
# True
loc과 iloc은 subsets를 보기위함, iat와 at으로 scalar values 출력
df.at[10, 'mag']iat는 integer base
df.iat[10, 8]Boolean mask를 이용한 filtering
df.mag > 2
# result는 true/false
df[df.mag >= 7.0]
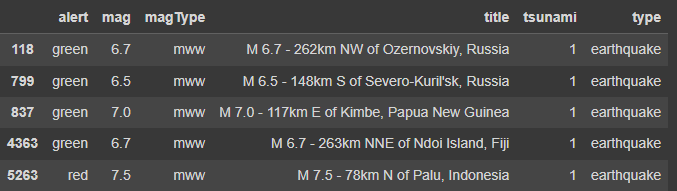
# result는 dataframeloc을 이용해 using masks
df.loc[
    df.mag >= 7.0,
    ['alert', 'mag', 'magType', 'title', 'tsunami', 'type']
]
and 이용(&)
df.loc[
    (df.tsunami == 1) & (df.alert == 'red'),
    ['alert', 'mag', 'magType', 'title', 'tsunami', 'type']
]
or 이용(|)
df.loc[
    (df.tsunami == 1) | (df.alert == 'red'),
    ['alert', 'mag', 'magType', 'title', 'tsunami', 'type']
]
non-null values만 출력 (df.column.contains(), df.column.notnull() 이용)
df.loc[
    (df.place.str.contains('Alaska')) & (df.alert.notnull()),
    ['alert', 'mag', 'magType', 'title', 'tsunami', 'type']
]col.between(), loc처럼 마지막 인덱스 포함
df.loc[
    df.mag.between(6.5, 7.5),
    ['alert', 'mag', 'magType', 'title', 'tsunami', 'type']
]
col.isin()
df.loc[
    df.magType.isin(['mw', 'mwb']),
    ['alert', 'mag', 'magType', 'title', 'tsunami', 'type']
]
.idxmin(), .idxmax()
df.loc[
    [df.mag.idxmin(), df.mag.idxmax()],
    ['alert', 'mag', 'magType', 'title', 'tsunami', 'type']
].filter(items=[ ]) : 리스트로 필터
df.filter(items=['mag', 'magType']).head().filter(like=[ ]) : 특정 문자열 포함
df.filter(like='mag').head().filter(regex=r'^t')
df.filter(regex=r'^t').head()
.set_index() 로 특정 인덱스 기준 필터
df.set_index('place').filter(like='Japan', axis=0).filter(items=['mag', 'magType', 'title']).head()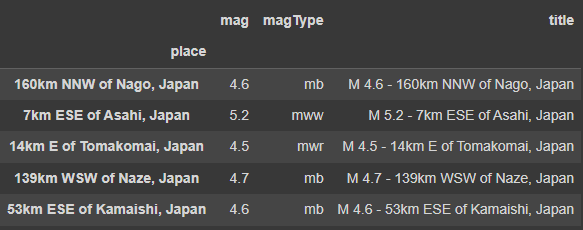
df.set_index('place').title.filter(like='Japan').head()place
160km NNW of Nago, Japan M 4.6 - 160km NNW of Nago, Japan
7km ESE of Asahi, Japan M 5.2 - 7km ESE of Asahi, Japan
14km E of Tomakomai, Japan M 4.5 - 14km E of Tomakomai, Japan
139km WSW of Naze, Japan M 4.7 - 139km WSW of Naze, Japan
53km ESE of Kamaishi, Japan M 4.6 - 53km ESE of Kamaishi, Japan
Name: title, dtype: object2-6. Adding and Removing Data
df에 열 추가
df['mag_negative'] = df.mag < 0
df.head()
ca와 california처럼 같은 대상인데 중복된 이름을 가진 entity가 있는지 확인
df.place.str.extract(r', (.*$)')[0].sort_values().unique()Replace them, 'parsed_place' 생성
df['parsed_place'] = df.place.str.replace(
    r'.* of ', '', regex=True # remove anything saying <something> of <something>
).str.replace(
    'the ', '' # remove "the "
).str.replace(
    r'CA$', 'California', regex=True # fix California
).str.replace(
    r'NV$', 'Nevada', regex=True # fix Nevada
).str.replace(
    r'MX$', 'Mexico', regex=True # fix Mexico
).str.replace(
    r' region$', '', regex=True # chop off endings with " region"
).str.replace(
    'northern ', '' # remove "northern "
).str.replace(
    'Fiji Islands', 'Fiji' # line up the Fiji places
).str.replace(
    r'^.*, ', '', regex=True # remove anything else extraneous from the beginning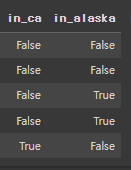
).str.strip() # remove any extra spacesassign()메소드로 여러 컬럼 한번에 생성
df.assign(
    in_ca=df.parsed_place.str.endswith('California'),
    in_alaska=df.parsed_place.str.endswith('Alaska')
).sample(5, random_state=0)
[Out]
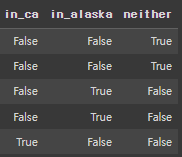
lambda 함수로 assign() 활용 가능
- assign()으로 전체 데이터프레임을 lambda 함수의 x로 pass into 시키기
assign으로 생성한 열 조건에 해당하지 않을 경우 true를 출력하는 neither 컬럼 생성
df.assign(
    in_ca=df.parsed_place == 'California',
    in_alaska=df.parsed_place == 'Alaska',
    neither=lambda x: ~x.in_ca & ~x.in_alaska
).sample(5, random_state=0)
[Out]
Concatenation
두개 데이터프레임 생성 (컬럼 개수 같은)
tsunami = df[df.tsunami == 1]
no_tsunami = df[df.tsunami == 0]

tsunami.shape, no_tsunami.shape
# ((61,10), (9271,10))
pd.concat([tsunami, no_tsunami]).shape
# (9332, 10)pd.concat([df1,df2]) == df1.append(df2)
tsunami.append(no_tsunami).shape
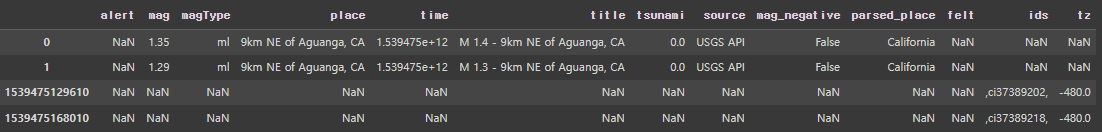
# (9332, 10)앞서 특정 컬럼만 불러와서 df에 저장했으므로, 다른 컬럼만 불러온 후 concat으로 합쳐서 원본 파일 전체 출력
additional_columns = pd.read_csv(
    'data/earthquakes.csv', usecols=['tz', 'felt', 'ids']
)
pd.concat([df.head(2), additional_columns.head(2)], axis=1)
[Out]

If Index doesn't align
additional_columns = pd.read_csv(
    'data/earthquakes.csv', usecols=['tz', 'felt', 'ids', 'time'], index_col='time'
)
pd.concat([df.head(2), additional_columns.head(2)], axis=1)
[Out]
concat하기 전에 index align 필요
tsunami와 no_tsunami df를 합치는데, no_tsunami df는 additional column이 존재,
join 방식을 inner로 정해주어 겹치는 부분만 합쳐지도록 concat 해주기
pd.concat(
    [tsunami.head(2), no_tsunami.head(2).assign(type='earthquake')], join='inner'
)
ignore_index = True => Sequential values 로 출력
pd.concat(
    [tsunami.head(2), no_tsunami.head(2).assign(type='earthquake')], join='inner', ignore_index=True
)del로 필요없는 컬럼 삭제
del df['source']
df.columns
컬럼이 남아있는지(삭제 되었는지) 확인
try:
    del df['source']
except KeyError:
    # handle the error here
    print('not there anymore')
pop() => It allow us to use the series we remove later
mag_negative = df.pop('mag_negative')
df.columns
pop 이후 해당 컬럼의 unique values
mag_negative.value_counts()[Out]
False    8841
True      491
Name: mag_negative, dtype: int64
pop 했던 컬럼 mag_negative가 True인 데이터만 볼 수 있음 (filter 가능)
df[mag_negative].head()drop() - 리스트로 삭제할 컬럼 여러개 입력 가능 (axis=0이 디폴트이지만 컬럼 입력시 자동으로 컬럼 삭제)
df.drop([0, 1]).head(2)
cols_to_drop = [
    col for col in df.columns
    if col not in ['alert', 'mag', 'title', 'time', 'tsunami']
]
df.drop(columns=cols_to_drop).head()
axis=1 입력해도됨
df.drop(columns=cols_to_drop).equals(
    df.drop(cols_to_drop, axis=1)
)
# True
inplace=True
df.drop(columns=cols_to_drop, inplace=True)
df.head()


